It was a volatile beginning for the New Year 2024 for the Indian stock markets. The Indian benchmark indices began the new year on a weak note by falling in the first half of the week. In the second half, they managed to recover and closed the week marginally lower. The resistances on the Nifty and Nifty Bank indices are holding very well. It is important for the indices to surpass this hurdle to move further higher. Else, the chances are high to see an intermediate correction before the overall uptrend resumes. As such, the price action in the coming days will be very important.
Among the sectors, the BSE IT and BSE Metals indices fell the most. They were down 1.43 per cent and 1.88 per cent respectively. The BSE Realty index surged 7.91 per cent and outperformed last week. It was followed by the BSE Healthcare and BSE Power index, up 3.27 per cent and 3.4 per cent respectively.
FPI flows
The Indian equity segment continue to get foreign money inflows. The foreign portfolio investors (FPIs) bought $573 million in the equity segment last week. The month of December saw a strong inflow of $7.94 billion. Continuing flows will aid in limiting the downside in the Sensex and Nifty.
Nifty 50 (21,710.80)
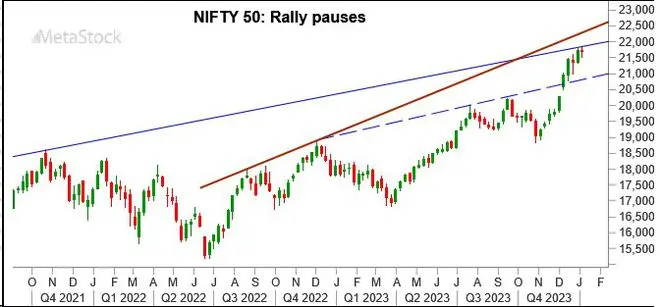
The resistance at 21,850 has held very well. Nifty 50 rose to a high of 21,834.35 on Monday last week, but failed to sustain higher. The index fell sharply from there to make a low of 21,500.35 before closing the week 21,710.80, down 0.09 per cent.
Short-term view: The immediate outlook is slightly mixed. On the chart, last week’s candle indicates indecisiveness in the market. The region between 21,850 and 21,900 will be the crucial resistance. Nifty has to breach 21,900 decisively in order to boost the bullish momentum and rise to 22,200-22,400 or 22,600 over the next few weeks.
Failure to breach 21,900 can keep the index under pressure to break 21,500 – an intermediate support and fall to 21,350-21,250 in the near term. It will also keep the Nifty under pressure to see 21,000 and 20,900 over the short term.

Chart Source: MetaStock
Medium-term view: The broad region between 21,000 and 20,500 will be a very strong support for now. As long as the Nifty stays above this support zone, the outlook will remain bullish. So the fall to 21,000-20,900 mentioned above will just be a correction within the current uptrend. As such, we can expect the Nifty to reverse higher again anywhere from the 21,000-20,500 region and see a fresh rally towards 23,200 in the coming months.
It is important to note that the region around 23,200 is a very strong long-term resistance. The current uptrend can find a top around that level. We can expect the Nifty to see a trend reversal from there, and a 10-15 per cent from the top of around 23,200. This correction can happen possibly in the second quarter this year. So, as the Nifty nears 23,000, that will be a time to turn cautious rather than becoming overly bullish.
Nifty Bank (48,159)
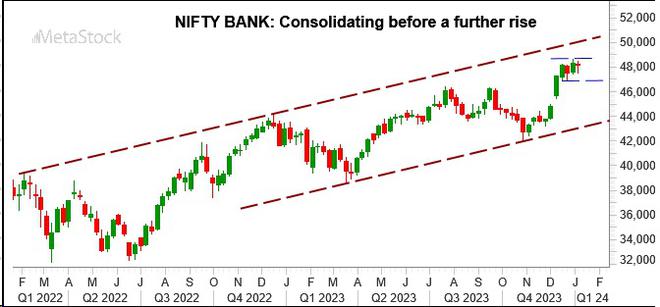
Nifty Bank index fell sharply in the first half of the week and made a low of 47,481.35 on Wednesday. Thereafter, the index managed to recover some of the loss and close the week at 48,159, down 0.28 per cent.
Short-term view: The Nifty Bank index has been struggling to get a sustained rise above 48,000 over the last few weeks. Strong resistance is in the 48,800-48,850 region. Failure to rise past 48,850 can keep the Nifty Bank index under pressure for a fall to 46,500-46,300. Intermediate support is in the 46,900-46,850 region. A break below it can trigger this fall.
On the other hand, a strong break above 48,850 can take the Nifty Bank index up to 50,300 in the coming weeks.

Chart Source: MetaStock
Medium-term view: The trend is still up. Strong support is in the 46,500-46,300 region. As long as the index stays above this support zone, the outlook will continue to remain bullish. As such, we expect the Nifty Bank index to break 48,850 if not immediately, but eventually and see a rise to 50,300-50,400 in the coming months. An eventual break above 50,400 can take the Nifty Bank index up to 52,000 or 53,300 over the medium term.
The levels of 52,000 and 53,300 are strong long-term resistances. We can expect the current uptrend to halt there. A reversal from there can trigger a strong corrective fall to 48,000-47,000, going forward. So, as the Nifty Bank index goes towards 52,000 and higher, the bias has to turn more cautious to look for a reversal rather than retaining the bullish view.
Sensex (72,026.15)
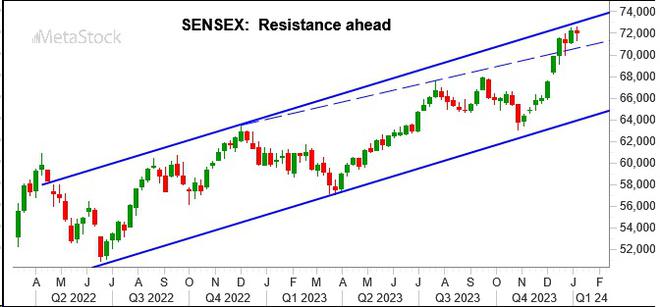
Sensex has been struggling to breach 72,500 over the last couple of weeks. The index touched a high of 72,561.91 initially, but failed to sustain. The index fell to 71,303.97 mid-week before recovering some of the loss towards the end of the week. Sensex has closed at 72,026.15, down 0.3 per cent.
Short-term view: The candlestick on the weekly chart for last week indicates indecisiveness in the market. Failure to rise past 72,500 can see an intermediate fall to 70,500-70,450 in the coming weeks. However, a fall below 70,450 is less likely. As such, the Sensex can breach 72,500 eventually and rise to 73,300-75,500 in the coming weeks.
Broadly, 70,450-74,500 can be the trading range for the short term. The outlook will turn negative if the Sensex breaks below 70,450. In that case, the index can see a fall to 69,000-68,800.

Chart Source: MetaStock
Medium-term view: The region around 73,500 is a very strong resistance. Sensex has to rise past 73,500 to move further up towards 75,000 and higher levels. For now, we expect the upside to be capped at 73,500. One leg of corrective fall to 68,000-67,000 is a possibility. From a big picture perspective, the trend will continue to remain up as long as the Sensex trades above 67,000. So after this corrective fall, a fresh leg of rally can take the Sensex up to 77,000-78,000 over the medium term.
Dow Jones (37,466.11)
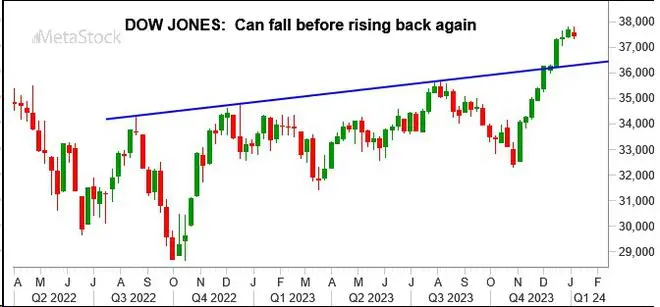
The Dow Jones Industrial Average is facing strong resistance around 37,800. The index made a high of 37,790.08 and has come down from there. It has closed the week at 37,466.11, down 0.59 per cent.
Outlook: The price action on the daily chart indicates that the index lacks strong follow-through buying above 37,700. This keeps the near-term outlook negative. Support is in the 37,100-37,000 region. The Dow Jones can fall to test this support zone this week.

Chart Source: MetaStock
A break below 37,000 can increase the selling pressure. Such a break can drag the Dow Jones down to 36,500 and even 36,000 in the next few weeks. However, from a big picture, the region around 36,000 is a very strong support. As such a fall beyond 36,000 is unlikely. So we can expect the Dow Jones to reverse higher anywhere from the 36,500-36,000 region. That leg of up move will have the potential to take the Dow Jones up to 38,000 and higher over the medium term.
To avoid the fall to 36,500-36,000, the index will have to sustain above 37,000. In that case, the chances will remain high for the Dow Jones to breach 37,800. Such a break can take it up to 38,500-39,000.


